
Friedman’s test is also called Friedman’s two-way ANOVA rank which is developed by an American economist Milton Friedman. This test is similar to the Kruskal-Wallis test and also an extension of the sign test. The Friedman test is used as an alternative to repeated measures of ANOVA. It uses ranks of data rather than their raw data to compute the test statistic. This test is non-parametric used for the comparison of three or more dependent samples. It is applied to data that is ranked and in the form of a two-way ANOVA design (randomized blocks). If the data is significantly different than normally distributed then the Friedman test is preferred over ANOVA. This test is always preferred over other non-parametric tests when the same parameter has been measured under different conditions on the same subject. For example, detection of blood glucose level before treatment, after one month treatment, and after three months of treatment.
The assumptions of the Friedman test are as follows:
- The group is a random sample from the population and one group of test subjects that are measured on three or more different occasions.
- There should not be any interaction between blocks (rows) and treatment levels (columns).
- The dependent variable is at least ordinal or continuous.
- The samples need not be normally distributed.
The hypothesis of the Friedman test is set to be as follows:
Null hypothesis: Ho: No difference between three conditions.
Alternative hypothesis: H₁: Differences between these three conditions.
In this test, the treatments are ranked within each block and then a summation of ranks is carried out. Compute the test statistic and determine critical value from the Chi-square distribution table (Appendix-III) with k-1 degree of freedom.
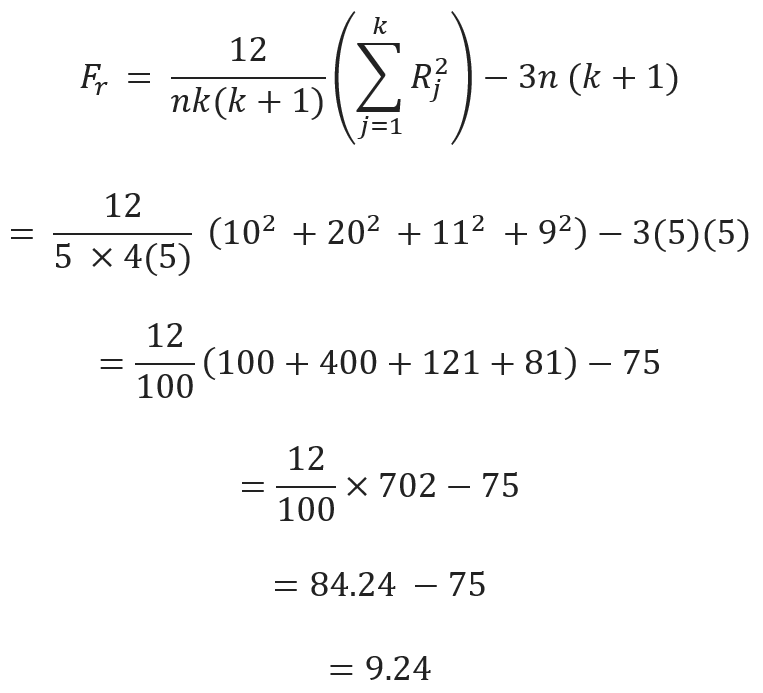
The test statics of Friedman’s test (Fr) is calculated by the following equation:
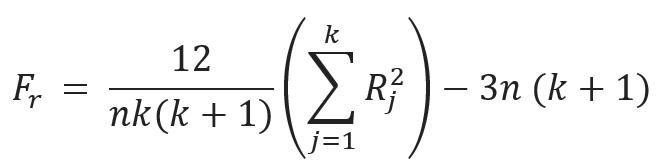
Where,
- n = Number of independent blocks or rows
- K = Number of groups or treatment levels or columns
- Rj=Sum of ranks from column 1
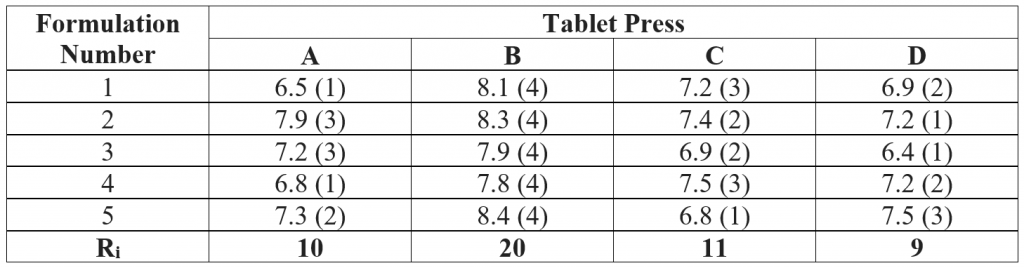
For example, the average hardness of 10 tablets is calculated for five different tablet products manufactured on four presses. The values in Table 9.2 are the ranks of the average hardness for each formulation over the four presses. For formulation 2, the lowest value (7.2) is assigned a rank 1 and the highest value (8.3) is assigned a rank 4. No ties occurred in this example of four presses. If one of the presses consistently has the highest rank, then it may conclude that the press produced harder tablets than the other presses. In this example, (Table), tablet press ‘B’ has the highest hardness value for all formulations. Hence, it indicates that tablet press ‘B’ produces harder tablets than the other presses.
If the sample sizes are sufficiently large, a Chi-square distribution can be used to approximate the test of significance.
A Chi-square value of 7.81 or larger is needed for significance at the 5% level. It may conclude that the tablet presses differ in tablet hardness. Table 9.2 indicates that press B produces significantly harder tablets than press A, press C, and press D.
Make sure you also check our other amazing Article on : Wilcoxon Rank Sum Test