Total Quality Management Introduction:
Table of Contents
The pharmaceutical industry is a key part of the health care system. The regulation of this industry is very important because one mistake in production or design can cause a more severe condition to the health care system. So, the maintenance of the quality of the drugs is so important in pharmaceutical industries because the poor quality of drugs can cause health hazards and economical burdens for both the government and patients. Total quality management is improvised in the industries to maintain the quality and safety of the drugs and prevention of defects rather than the detection. The pharmaceutical quality system is described under ICH guideline Q10. The concepts, key points of quality improvement of TQM were proposed by several eminent like Edward Deming, Joseph Juran, Philip Crosby, Genichi Taguchi, etc.
Definition:
As per the International Organization of Standard (ISO), TQM is defined as: “A management approach of an organization centered on quality, based on the participation of all its members and aiming at long term benefits to all members of the organization and society”.
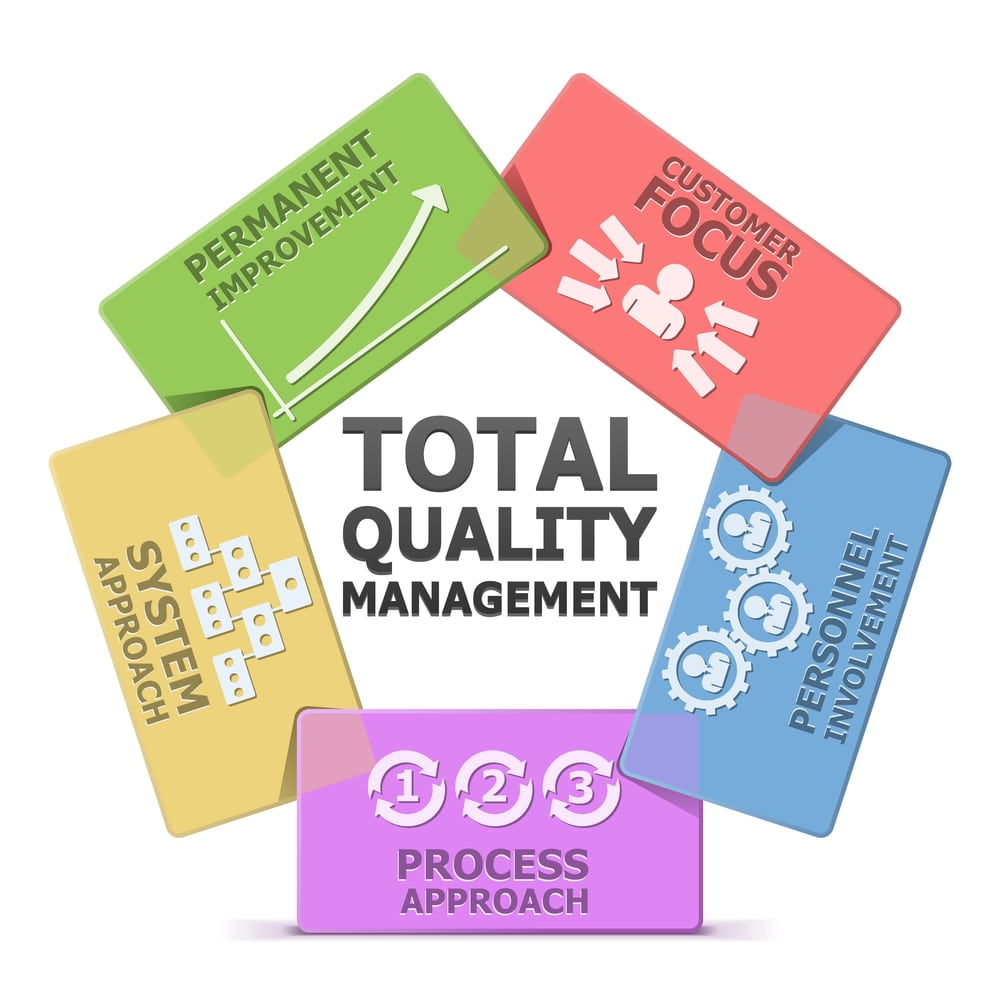
Total Quality Management Focuses On
There are three main key components of Total Quality Management:
1. Consumer/Customer focus
2. Involvement of employee
3. Continuous improvement
TQM is controlled by customer focus, process (planning, management, and improvement), and total participation. According to previous literature (Mazumder et al, 2011), the key ingredients of TQM are:
1. Strategic commitment by the management
2. Employee involvement
3. Materials used in the organizations
4. Precise techniques used by the organizations and
5. Improved methods
Statistical Quality Control:
To achieve accuracy, statistics play an important role in quality management systems. The seven major tools used for statistical process control are:
1. Histogram: A histogram is an accurate representation of the distribution of numerical data (related to one variable).
2. Pareto chart: A Pareto chart is a type of chart that contains both bars and a line graph, where individual values are represented in descending order by bars, and the cumulative total is represented by the line.
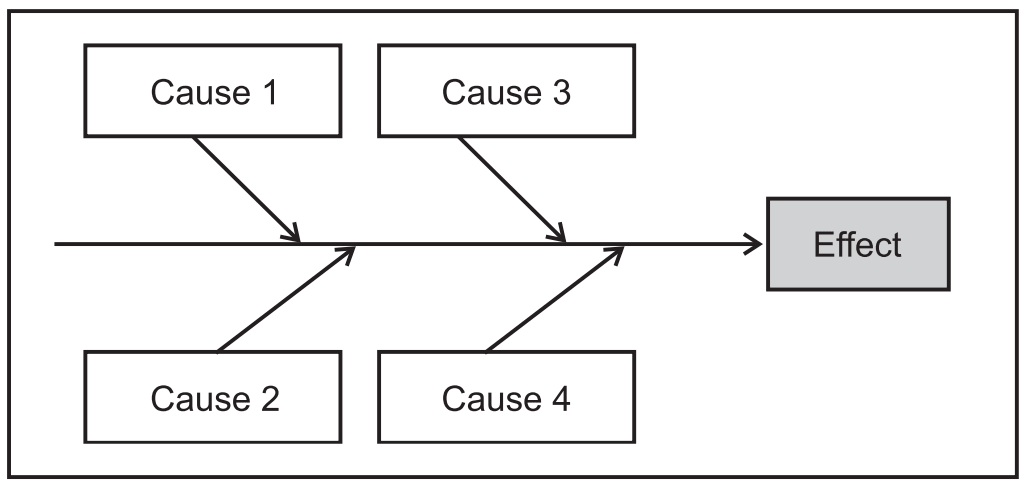
3. Cause and effect diagram (Fishbone diagram): It helps to identify the possible causes of a specific problem or quality characteristic.
4. Defect concentration diagram.
5. Control chart: The control chart is a graph used to study how a process changes over time. Data are plotted in time order. A control chart always has a central line for the average, an upper line for the upper control limit, and a lower line for the lower control limit.
6. Scatter diagram: The scatter diagram graphs pairs of numerical data, with one variable on each axis, to look for a relationship between them. If the variables are correlated, the points will fall along a line or curve.
7. Check sheet: A check sheet is a form or document used to collect data in real-time at the location where the data is generated.
Advantages:
1. Improve in quality and safety of the drugs.
2. Improvement of customer satisfaction.
3. Improvement of the reputation of the industry.
4. Total involvement of employees with higher morals and responsibilities.
5. Lower economic burden.
Make sure you also check our other amazing Article on : Clinical Research Protocols