
Two theories have been proposed to explain the change of colour of acid-base indicators with a change in pH.
1. Ostwald’s Theory
Table of Contents
In 1894, Ostwald proposed the theory of indicator based on ionization. According to this theory, the colour change is due to the ionization of the acid-base indicator. The unionized form has a different colour than the ionized form. The ionization of the indicator is largely affected by acids and bases as it is either a weak acid or a weak base. In case, the indicator is a weak acid, its ionization is very much low in acids due to common H+ ions while it is fairly ionized in alkalies. Similarly, if the indicator is a weak base, its ionization is large in acids and low in alkalies due to common OH– ions.
Example: The ionisation of an acid indicator or HIn may be represented as,
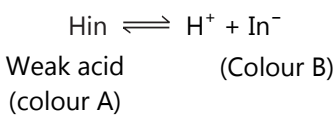
The unionized molecule Hin has one colour (colour A), while the ionized ion has another colour (colour B). The above ionization is characterized by applying the Law of Mass action,
where, ‘KIn’ is known as indicator constant.
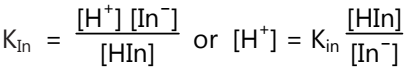
Taking logarithms on both sides and changing the sign, we have
Thus colour of the indicator is determined by the ratio [In/Hin] and is governed by the pH of the solution.
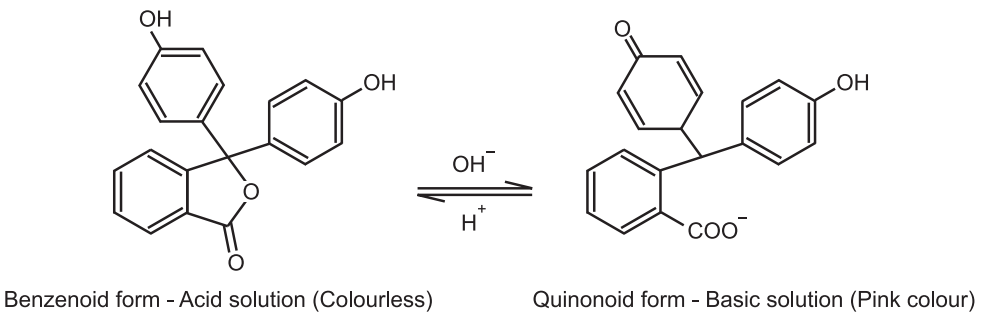
Example: Considering phenolphthalein (a weak acid) an important indicator, Ostwald’s theory can be illustrated as follows:
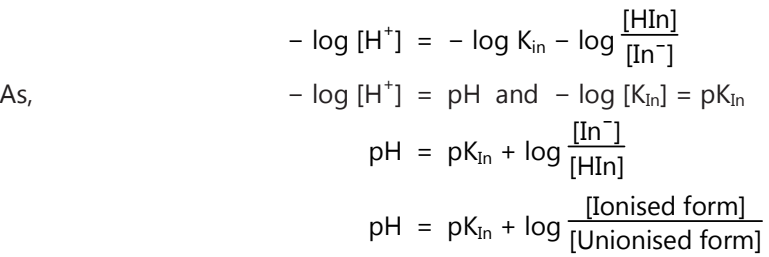
Phenolphthalein: It can be represented as HPh. It ionises in solution to a small extent as:
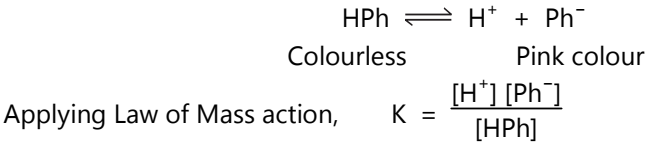
The undissociated molecules of phenolphthalein are colourless while Ph- ions are pink in colour. In the presence of an acid, the ionization of HPh is practically negligible as the equilibrium shifts to the left-hand side due to the high concentration of H+ ions. Thus, the solution would remain colourless. In addition to alkali, hydrogen ions [H+] are removed by hydroxyl ion [OH−] in the form of water molecules and the equilibrium shifts to the right-hand side. Thus, the concentration of Ph– ions increases in the solution and it gives pink colour to the solution.
Salient features of Ostwald ionic theory of acid-base indicators:
1. An acid-base indicator is usually a weak organic acid (e.g., phenolphthalein) or base (e.g., methyl orange). Its undissociated form gives a colour which is different from its ions. Thus, the colour change is due to ionization.
2. If the indicator is a weak acid, the colour of its anions will be deeper than that of the unionized form. In case, it is base, its cation is deep coloured than that anion.
3. Although acid-base indicators are weak electrolytes, their dissociation increases with the addition of strong acid or strong base.
2. Quinonoid Theory/ Resonance Theory
According to this theory, the acid-base indicators exist in two tautomeric forms having different structures. Two forms are in equilibrium. One form is termed the benzenoid form and the other quinonoid form.
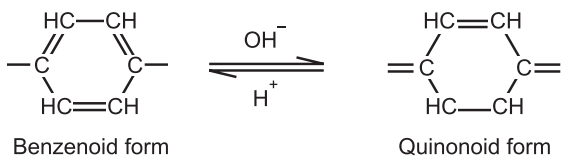
The two forms have different colours. The colour change is due to the inter-conversation of one tautomeric form into other. One form mainly exists in an acidic medium and the other in an alkaline medium.
Thus, during titration the medium changes from acidic to alkaline or vice-versa. The change in pH converts one tautomeric form into other and thus, the colour change occurs.
Examples:
1. Phenolphthalein (a weak acid) has a benzenoid form in an acidic medium and thus, it is colourless while it has a quinonoid form in an alkaline medium which has a pink colour.
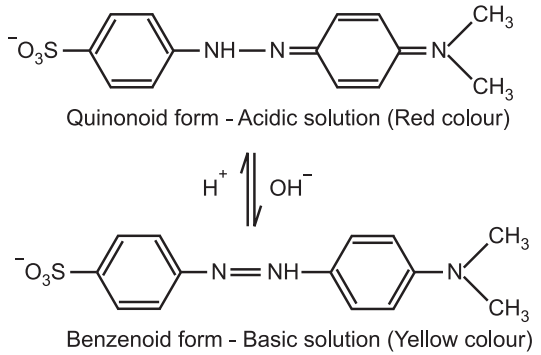
2. Methyl orange (a weak base) has a benzenoid form in an alkaline solution and a quinonoid form in an acidic solution. The colour of the benzenoid form is yellow while that of the quinonoid form is red.
Salient features of Quinonoid theory of acid-base indicators:
1. Each acid-base indicator exists in two or more tautomeric forms; one in an acidic medium and the other in an alkaline solution.
2. The colours of the two tautomeric forms are different due to the difference in their structures. One of them has a benzenoid structure which is either colourless or light coloured, while the other has deep coloured quinonoid structure.
MIXED INDICATOR
In some titration like titration between weak acid and weak base, the pH range is very narrow and colour change with ordinary acid-base indicator is not possible. In such titrations, the endpoint may be achieved by mixing suitable indicators of the required pH range. These are generally selected by considering their pKIn values closed together and overlapping colours are complementary at an intermediate pH value.
Example: A mixture of equal parts of neutral red (0.1% in alcohol) and methylene blue (0.1% in alcohol) gives a colour change from violet to blue-green while passing from acid solution to alkaline solution, at an equivalence point at pH 7.
The colour change of a single indicator can be improved using pH-sensitive dyestuff to produce a complement of one of the indicator colours.
Example: Addition of xylene cyanol in methyl orange, the colour changes from green to grey to magenta while passing from an alkaline solution to an acidic solution.
UNIVERSAL INDICATORS
Universal indicators are indicator mixtures which change colour over a wide range of pH. So, to determine the pH of a solution we need not have to use all the indicators.
Example: Mixture of 0.1 g of phenolphthalein, 0.2 g of methyl red, 0.3 g methyl yellow, 0.4 g bromothymol blue and 0.5 g of thymol blue in 500 mL of absolute alcohol and add a sufficient amount of sodium hydroxide solution until the colour changes to yellow.
This indicator shows the colour change as, pH-2 → red, pH-4 → orange, pH-6 → yellow, pH-8 → green and pH-10 → blue For colorimetric determination of pH several universal indicators are available in solution as well as test paper form.
Make sure you also check our other amazing Article on : What is the common ion effect?